
Making maps
Making maps is one of the coolest things ever.
Whole regions suddenly become a little easier to understand. Or they can be fictional lands of our wildest imaginations.
You can see where natural and constructed features are, paths, obstacles, open plains and densely vegetated areas.
So I’m making a map for myself of what I’d like to see in Popes Produce future.
This section on the right was created 10 years ago when I was trying to understand what new home looked like - and always good to have an opportunity to play with colour.
Visual information makes sense. It gives me a pictograph of what’s up ahead. It’s prettier than a to do list. What’s possible for this space and what are the constraints? How do you jigsaw it all together?
Where’s the abundance and where are the vulnerabilities? When you understand the playing field, opportunities open up.
For us - people love to connect. We love to connect. We love to see what’s possible in our community. How can we share with a wider field?
I’ve created a super basic overview for this year’s market garden season, (yet to be fully illustrated) using mapping to inform a business plan and calendar. Using previously observed information like - when do we have enough sunlight to grow well ? From end of September until June (harvest season is Oct – beginning July). How much food to produce ? This years goal = 1.5tonnes!
Knowing what are our the reliable crops? When is the most opportune time to plant?
When is there space and time during gardening and building to host events?(Which we love) When is social time?
How soon do you need to let people know?What’s a good living financial target? Is all of this sustainable? Time and life will tell. I’ll just keep exploring the map and creating the place we wish to be.
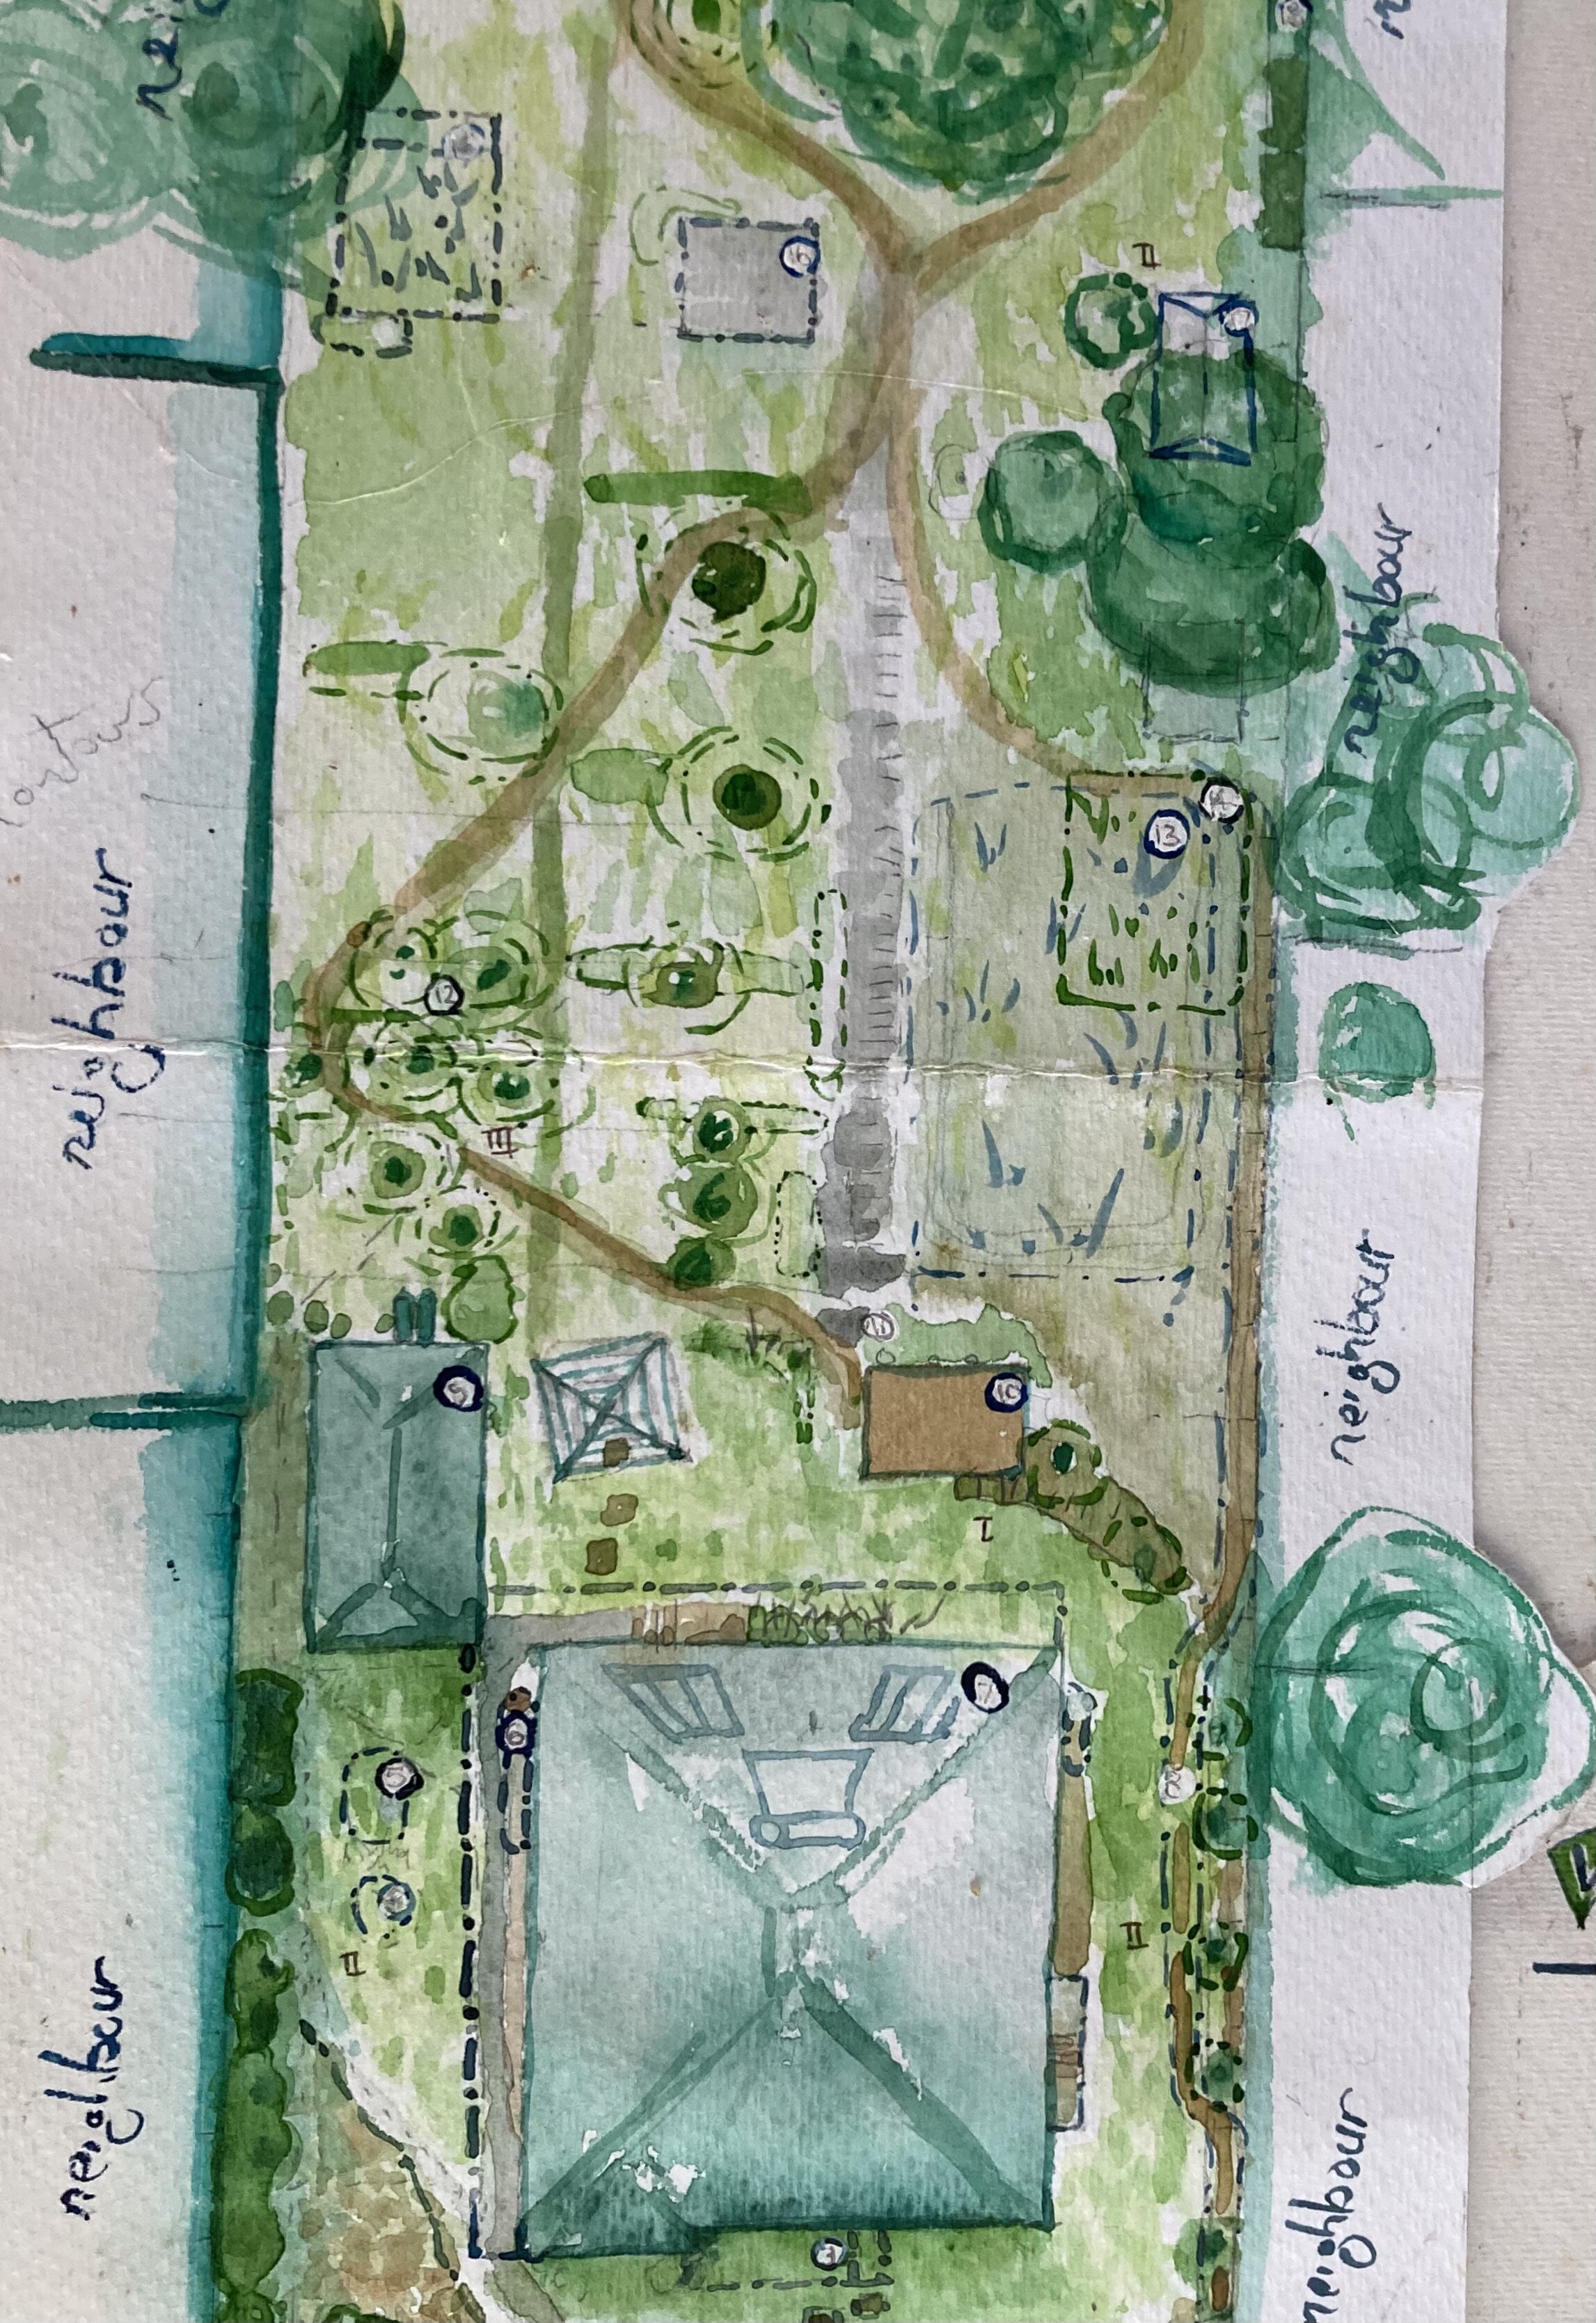
Hand drawn map from 2010